Final Project
Table of Contents:
- Deadline
- Introduction
- Part 1: Intro to GTSAM
- Part 2: SLAM Implementation
- Implementation Overview
- Submission Guidelines
- Collaboration Policy
Deadline
11:59 PM, Tuesday, December 20, 2022
- No late days allowed in this project. Submissions made by 11:59PM December 16 will receive extra credit equal to 20% of their grade on this project.
Introduction
Factor graphs are graphical models that are well suited to modeling complex estimation problems such as Simultaneous Localization and Mapping (SLAM) or Structure from Motion (SfM). You might be familiar with another often used graphical model, Bayesian Networks [1]. Unlike Bayesian Networks, which are directed acyclic graphs (DAG), factor graphs are bipartite graphs consisting of factors connected to variables. Variables represent the unknown random variables and factors represent probabilistic information on those variables, derived from measurement or prior knowledge.
In this project, you’ll implement a Bayesian Network-based solution to SLAM, an estimation problem that’s ubiquitous in robotics. You’ll first familiarize yourself with the algorithm in a simplified setting, before diving into the full problem. Both our “toy problem” and your project are based on the GTSAM[2] (“Georgia Tech Smoothing and Mapping”) toolbox which can be downloaded from this link.
It’s surprising how effectively the factor graph-based frameworks can solve a problem as complex as SLAM (where they provide state-of-the-art performance). Excited already?
For more details about the homework refer to the relevant course notes.
Part 1: Intro to GTSAM
To help you familiarize yourself with GTSAM and its application to SLAM, we’ve implemented a “toy example” application. Find it here. We highly recommend that you install and run it, and gain an understanding of how the code works, before moving on to the rest of the project.
Part 2: SLAM Implementation
Now that you’re familiar with how GTSAM can be applied to SLAM in the 2D setting, you’re ready to implement it yourself– in 3D!
We’ve recorded some videos from the perspective of a small drone. Your task is to build a map based on the observation measurements the drone makes.
You’ll use data from the DataMapping.mat file to build a map and localize your robot on the map (Simultaneous Localization and Mapping) using the GTSAM package.
The Environment
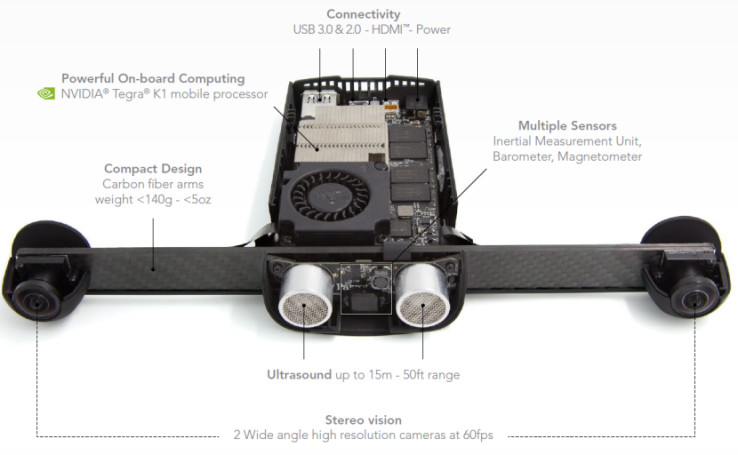
The provided data for this phase was collected with a hand-held SLAMDunk sensor module [3] (shown in Fig. 1), manufactured by Parrot R , simulating flight patterns over a floor mat of AprilTags [4] each of which has a unique ID.
The data contains the rectified left camera images, IMU data, SLAMDunk’s pose estimates, AprilTag [4] detections with tag size and camera intrinsics and extrinsics. All units are in m, rad, rads^1 and ms^2 if not specified.
Camera Intrinsics and Extrinsics are given specifically in CalibParams.mat and has the following parameters:
Khas the camera intrinsics (assume that the distortion coefficients in the radtan model are zero).TagSizeis in size of each AprilTag in meters.qIMUToChas the quaternion to transform from IMU to Camera frame (QuaternionW,QuaternionX,QuaternionY,QuaternionZ).TIMUToChas the translation to transform from IMU to Camera frame(TransX,TransY,TransZ).
The .mat file for any of the sequence (in the format DataNAME OF SEQUENCE.mat for e.g., DataSquare.mat where Square is the sequence name) will contain the following data:
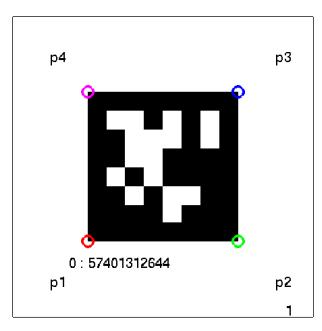
DetAllis a cell array with AprilTag detections per frame. For e.g., frame 1 detections can be extracted asDetAll{1}. Each cell has multiple rows of data. Each row has the following data format:[TagID, p1x, p1y, p2x, p2y, p3x, p3y, p4x, p4y]- Here
p1is the left bottom corner and points are incremented in counter-clockwise direction, i.e., thep1x,p1yare coordinates of the bottom left,p2is bottom right,p3is top right, andp4is top left corners (Refer to Fig. 2). You will use the left bottom corner (p1) of Tag 10 as the world frame origin with positive X being direction pointing from p1 to p2 in Tag 10 and positive Y being pointing from p1 to p4 in Tag 10 and Z axis being pointing out of the plane (upwards) from the Tag.
- Here
IMUis a cell array where each row has the following data:[QuaternionW, QuaternionX, QuaternionY, QuaternionZ, AccelX, AccelY, AccelZ, GyroX, GyroY, GyroZ, Timestamp]- You do not need the IMU readings for this project, however, if you find a creative way to use it, please feel free to use it.
LeftImgsis a cell array where each cell is a Image.TLeftImgsis the Timestamps forLeftImgs. For e.g.LeftImgs{1}was collected at timeTLeftImgs(1).Poseis an array with each row in the form:[PosX, PosY, PosZ, QuaternionW, QuaternionX, QuaternionY, QuaternionZ, EulerX, EulerY, EulerZ, Timestamp]- Here ZYX Euler angle was used which is the default for Matlab’s
quat2eulfunction.
Implementation Overview
Download the starter code and data here
Code
The starter code can be found in the code folder. There are two .m files in the folder:
SLAMUsingGTSAM.m and Wrapper.m. Your SLAM implementation goes in SLAMUsingGTSAM (you may also use helper functions in additional files). The script Wrapper.m is given for your debugging only.
The input and output for the SLAMUsingGTSAM are given in the “Environment” section above. The SLAMUsingGTSAM function has two return
arguments, LandMarksComputed and AllPosesComputed:
LandMarksComputedis an array of landmark locations.- Each row is of the form
[TagID, p1x, p1y, p2x, p2y, p3x, p3y, p4x, p4y]. - Note that the rows have to be sorted in ascending order by TagIDs.
- Each row is of the form
AllPosesComputedis an array of 6DOF poses.- Each row gives the pose measurement at a single camera timestep.
- Each row is of the form
[PosX, PosY, PosZ, Quaternion, QuaternionX, QuaternionY, QuaternionZ].- (We use quaternions because euler angles flip near singularity conditions– similar to the ones we are operating in.)
Please note:
- Do NOT add any subdirectories.
- Comment out any visualization code or debug print statements before submitting.
Submission Guidelines
We will deduct points if your submission does not comply with the following guidelines.
Please submit the project once for your group – there’s no need for each member to submit it.
File tree and naming
Your submission on Canvas must be a zip file, following the naming convention YourDirectoryID_proj4.zip. For example, xyz123_proj4.zip. The file must have the following directory structure:
YourDirectoryID_proj4.zip/code/SLAMusingGTSAM.m- *(any dependencies of
SLAMusingGTSAM.m)
report.pdf
Report
You will be graded primarily based on your report.
Logistics and bookkeeping you must include at the top of your report:
- The name of each group member.
- A brief (one paragraph or less) description of what each group member contributed to the project.
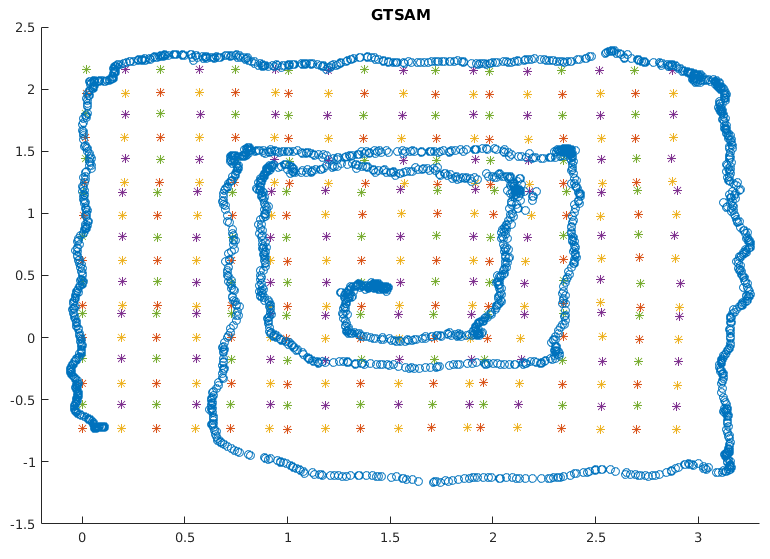
You must include output plots of the landmarks in 3D with the camera poses/localization, as shown in the example below.
We want you to demonstrate an understanding of the concepts involved in the project, and to show the output produced by your code.
Assume that we’re familiar with the project, so you don’t need to spend time repeating what’s already in the course notes. Instead, focus on any interesting problems you encountered and/or solutions you implemented.
As usual, your report must be full English sentences, not commented code. There is a word limit of 1500 words and no minimum length requirement.
Collaboration Policy
We encourage you to work closely with your groupmates, including collaborating on writing code. With students outside your group, you may discuss methods and ideas but may not share code.
For the full collaboration policy, including guidelines on citations and limitations on using online resources, see the course website.
References:
[1] Bernd Pfrommer, Nitin Sanket, Kostas Daniilidis, and Jonas Cleveland. Penncosyvio: A challenging visual inertial odometry benchmark. In 2017 IEEE International Conference on Robotics and Automation (ICRA), pages 3847–3854, May 2017.
[2] Michael Bloesch, Michael Burri, Sammy Omari, Marco Hutter, and Roland Siegwart. Iterated extended kalman filter based visual-inertial odometry using direct photometric feedback. The International Journal of Robotics Research, 36(10):1053–1072, 2017.
[3] Parrot. SLAMDunk. http://developer.parrot.com/docs/slamdunk/, 2016.
[4] Edwin Olson. AprilTag: A robust and flexible visual fiducial system. In Proceedings of the IEEE International Conference on Robotics and Automation (ICRA), pages 3400–3407. IEEE, May 2011.